Thanks Will. I think we should be thinking of ways to slice and present data. A bad hour is bad enough, if it’s the hour that you happened to be walking by. I’m thinking of phrases like ‘worst hour this week’ or ‘worst air for 24 days, measured hourly’ or something like that. That is, looking not at averages but at excursions, and trying to present it in a moderately human-friendly way.
Interesting - so like “gamified” badges, only bad 
Once I’ve done the latest UI changes, I was thinking we could write in an anomaly detector to auto-things like the above either with a “weird event” badge or request for comment/annotation. Would be better done on the backend, but as a PoC we there are some opensource JS anomaly detection libraries around.
It’s surprising (to me) that the existing projects (so far as I can tell) don’t have anomaly detection built in.
I feel there’s an art to be developed, of presenting terms like “90% percentile” or ''500-year flood" in terms that make immediate sense to everyone.
1 Like
Interesting article on calibration - https://www.hindawi.com/journals/js/2018/5096540/
In order to help free up some of the load on PJ, we’re looking for someone that can help with the design of sensor units housing and assembly. If anyone is interested in knows anyone please get in touch
I can help with that. I’m good with CAD. The only issue would be that I am not local to Frome but I’m sure we can work something out. Are these planning to be 3D printed?
Hey Joe,
Awesome… Our objective is to create an internal housing unit that can hold the ciruit board and other components in place. PJ has been tweaking a design he downloaded to make it more efficient. I’m sure he wouldn’t mind explaining how far he’s got and what he reckons needs doing next. I’ll drop him a message…
see


In terms of you being a bit out of town, I don’t see that being an issue. I can always drop round some units
Quick note off the back of the call with @Joe & @danny_hearn earlier.
I found a study on the PCB-type antenna (built in to the NodeMCU WiFi module) vs. ceramic antenna (on the D1Mini Pro) - it was an indoor study, but it suggests:
- the smaller ceramic type shows stronger signal than the PCB version of our current unit
- the external antenna (unsurprisingly) beats them all
https://www.researchgate.net/publication/332527943_RSSI_Comparison_of_ESP8266_Modules
Seemingly the difference is down to the ceramic type being less susceptible to interference.
1 Like
I have units 6 (PJ dropped it off here yesterday) and 9 (using the new ducting from Joe) set up side by side outside my backdoor.
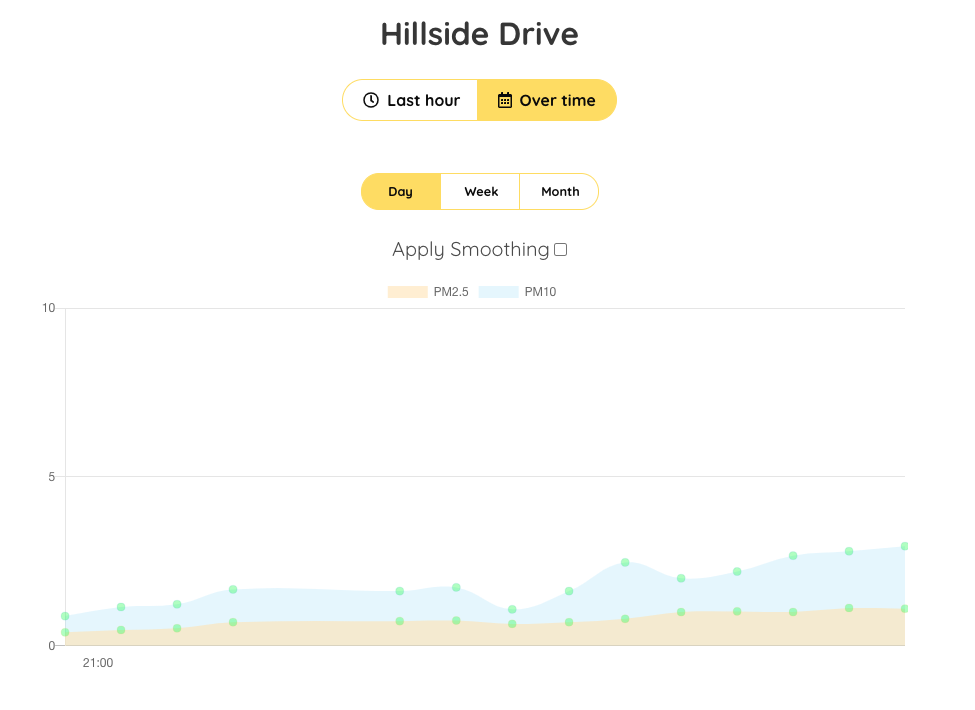
Sensor 6 (old design - scale is 0-10)
Sensor 9 (scale is 0-20):
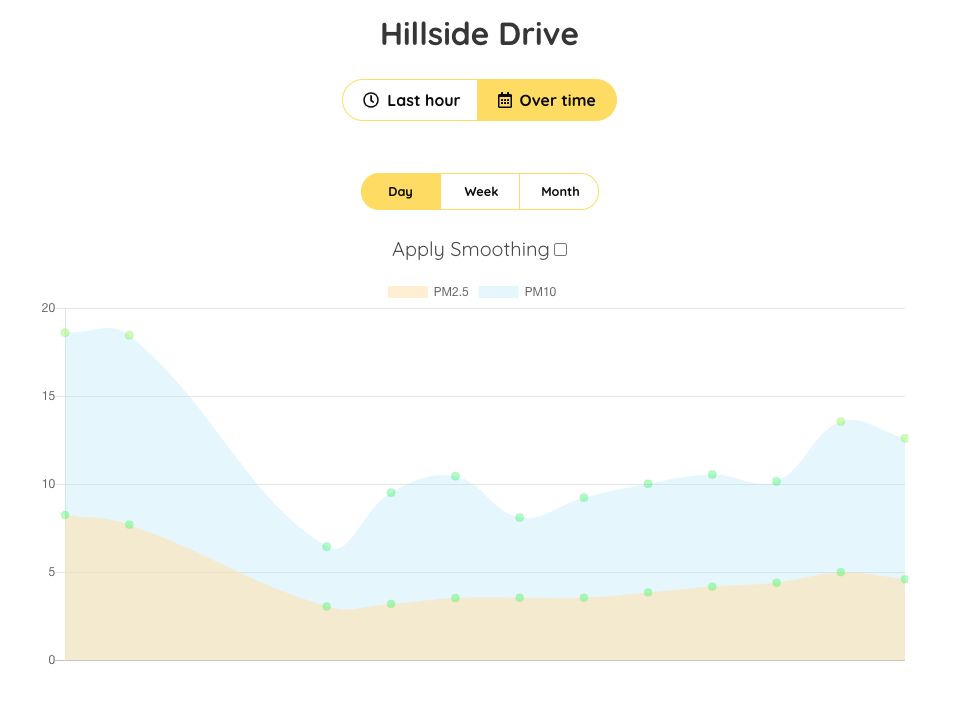
First few of readings were indoors (after the soldering iron was on) - old unit (#6) has a couple of extra readings at the start (I was still registering the new unit (#9) at that point).
I’ll need to unplug them tomorrow afternoon to show/demo, but I’m aiming to run them for a week to capture the data for comparison - pretty much no-contest, but still worth capturing the data.
Still waiting for the round pin headers I need for the MCU (first order I made delivered the wrong type).
We’ll need some more MCUs at some point as the new setup is looking good & we only have 2 of this type right now.
Aslo, one revision I’m considering for the PCB is a power connector to allow powering directly (bypassing the USB socket, or allowing us to use a lower power consumption module & making it less accessible for reprogramming if deployed in a public space)
1 Like
Worth a scan.
That’s quite shocking - thanks for the link.
Big up (thank you) to you guys for doing a ‘monstrous’ job on this sensor project. By the way, do we make internal* sensors?
We’ve not built anything for air quality indoors so far.
The same box could be used for particulate matter, but for internal spaces there are gasses like CO2 & formaldehyde which are important as well - for different reasons to particulate matter, but it would make sense to measure those on an indoor project.
Side note
although that article is about wood fires, during testing/setup we have seen large PM values from:
- chip fryers
- electric ovens
- humidifier (ultrasonic)
The humidifier one is interesting as there’s research suggesting drier air in winter from central heating and the fact cooler winter air can hold total less water, contributes to viral infection risk (including some directly studying COVID-19).
With dry air being a risk, increasing humidity could be healthy, but it turns out ultrasonic humidifiers increase PM. This is generally put down to minerals in the water becoming airborne, with some likely coming from small water droplets being picked up as PM at the sensor.
There’s some debate whether water droplets are making the numbers look higher & not much info on whether the “white dust” particles from minerals in the water are dangerous, but running a humidifier for a few hours makes the PM numbers look like New Delhi on a bad day.
Oh, the humidifier risk is interesting… especially as I used a humidifier a lot to try to clear the house of smoke after we had a chimney incident last year. Anyhow, Virginia Tech suggest using deionised water for the purpose. And it’s also noted elsewhere that showers (especially hot showers!) have a similar air-water interface issue.
Can’t remember if we saw this before Enviro for Raspberry Pi - Monitor your world! – Pimoroni
Also thought you’d all find this interesting!
Read more here
https://twitter.com/blprnt/status/1357715953841242114?s=21
This is basically what we’ve talked about doing!
1 Like
